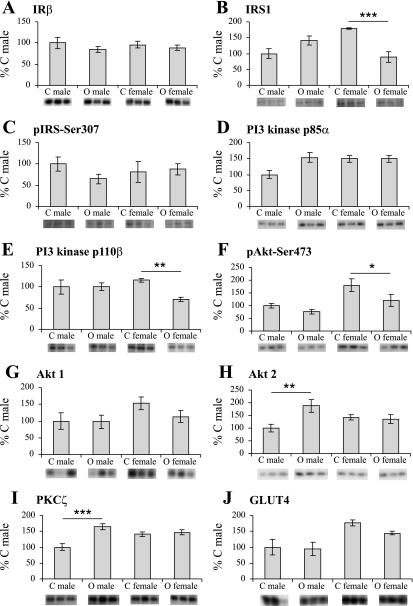
Fig. 1.
Expression and phosphorylation of key proteins involved in insulin signaling A: Insulin receptor β subunit (IRβ); B: IRS1; C: phospho-IRS-Ser307; D: P13 kinase p85α regulatory subunit; E: P13 kinase p110β catalytic subunit; F: phospho-Akt-Ser473; G: Akt1; and H: Akt2; I: PKCζ; and J: GLUT4. Bars represent mean expression/phosphorylation values for control offspring (C) and offspring of obese dams (O) ± SE, expressed as a percentage of mean male control; n = 6 per group. Images of representative blots of the respective proteins are shown below corresponding bar graphs. *P < 0.05, **P < 0.01, ***P < 0.001 compared with the same sex control.

