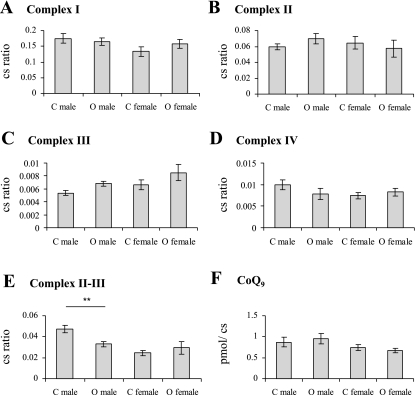
Fig. 2.
Mitochondrial enzyme activities. A–D: individual mitochondrial enzyme activities. E: linked mitochondrial complex II-III enzyme activity. Bars represent mean enzyme activity normalized to citrate synthase (cs). F: mitochondrial CoQ9 content. Bars represent mean CoQ concentration normalized to citrate synthase (cs). Control offspring (C) and offspring of obese dams (O) ± SE; n = 6 per group. **P < 0.01, compared with the same sex control.

