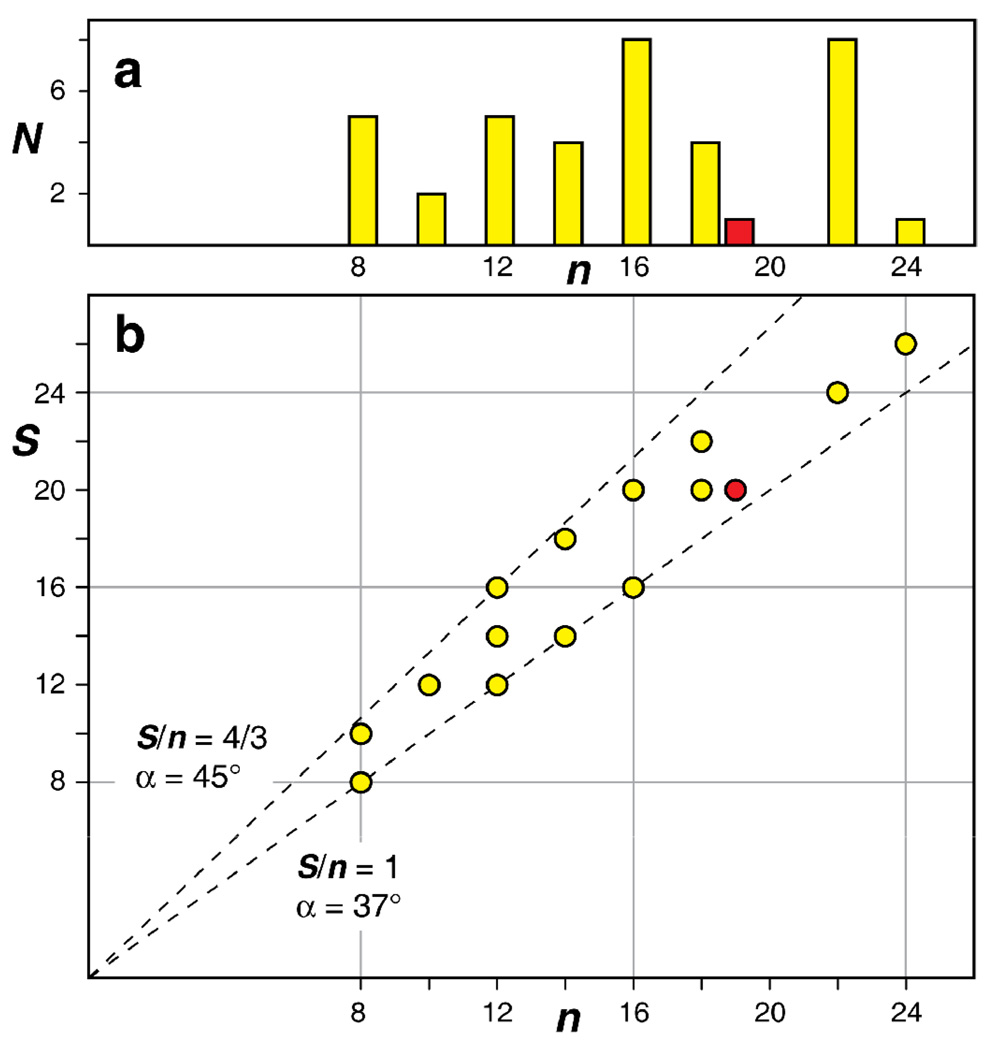
Figure 2.
Statistical analysis of all known β-barrel membrane protein structures [25]. (a) Histogram of the number of known unique β-barrel membrane proteins, N, vs. the number of β-strands, n. Yellow are prokaryotic proteins, red is the eukaryotic VDAC-1. (b) Combinations of shear numbers, S, and strand numbers, n that have been observed at least once are marked by circles in the same color coding as in panel a. The dashed lines mark the S/n ratios of 1 and 4/3. The corresponding angles between the membrane normal and the β-strands are indicated [19]. β-barrels resulting from a multimerization were not included in the analysis.

