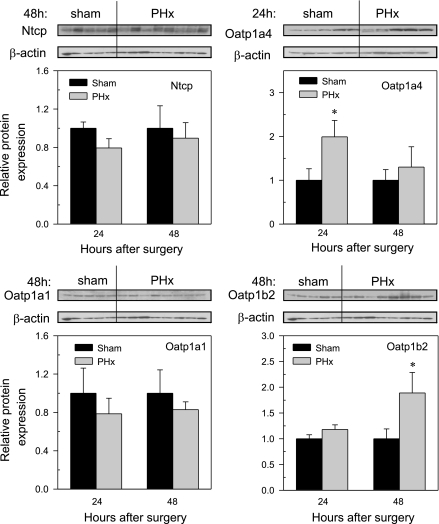
Fig. 11.
Oatp1a1, Oatp1a4, Oatp 1b2, and Ntcp protein abundance in livers of mice 24 and 48 h following sham and PHx surgery. Western blots for Oatp1a1 (∼70 kDa), Oatp1a4 (∼70 kDa), Oatp1b2 (∼75 kDa), and Ntcp (∼50 kDa) were performed with use of liver membrane protein fractions (40 μg protein/lane) from sham- and PHx-operated mice 24 and 48 h after surgery. β-Actin (∼45 kDa) blot was used as a protein loading control for each transporter. Bars represent the Oatp1a1, Oatp1a4, Oatp1b2, or Ntcp protein expression ± SE of 5–6 mice, and representative blots at 48 h are shown. In the case of Oatp1a4, the 24-h representative blot is shown. The scales for mean relative protein amount differ for each transport protein. *Statistical difference (P < 0.05) from the respective values of sham-operated mice.

