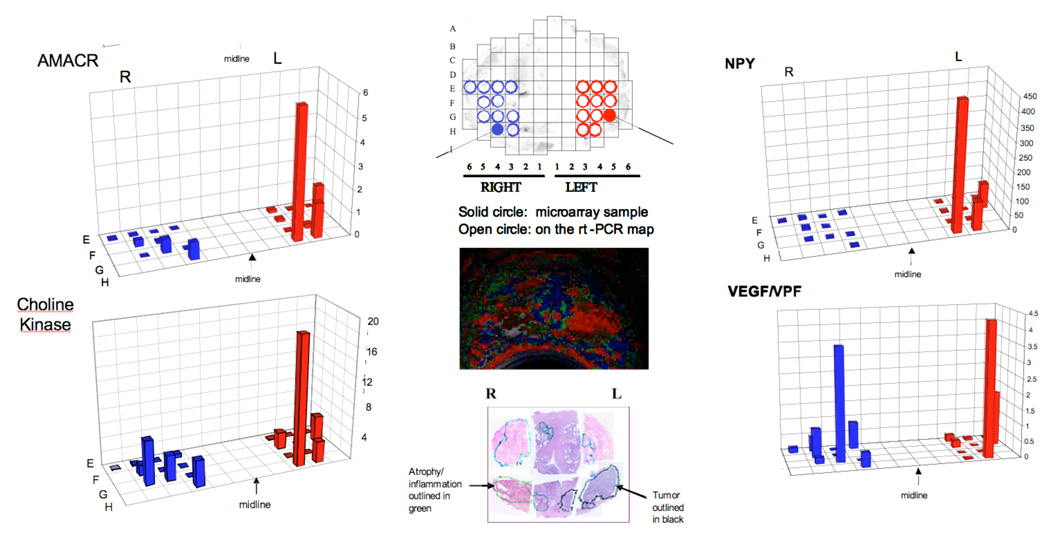
Figure 2.
Spatial overlay maps showing results of RNA microarray and rt-PCR analysis for AMACR, Choline kinase, NPY and VEGF. The color-coded maps derived from the analysis of DCEMRI as well as the histopathology (H and E stain) are shown for spatial reference. Note the two solid circles indicated in the tissue print grid that show the regions used for microarray analysis.

