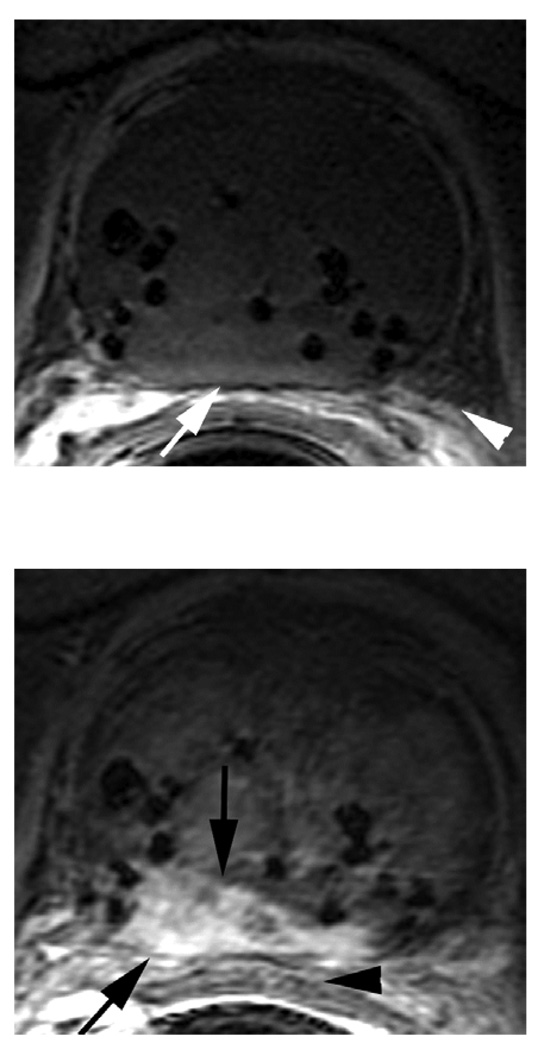
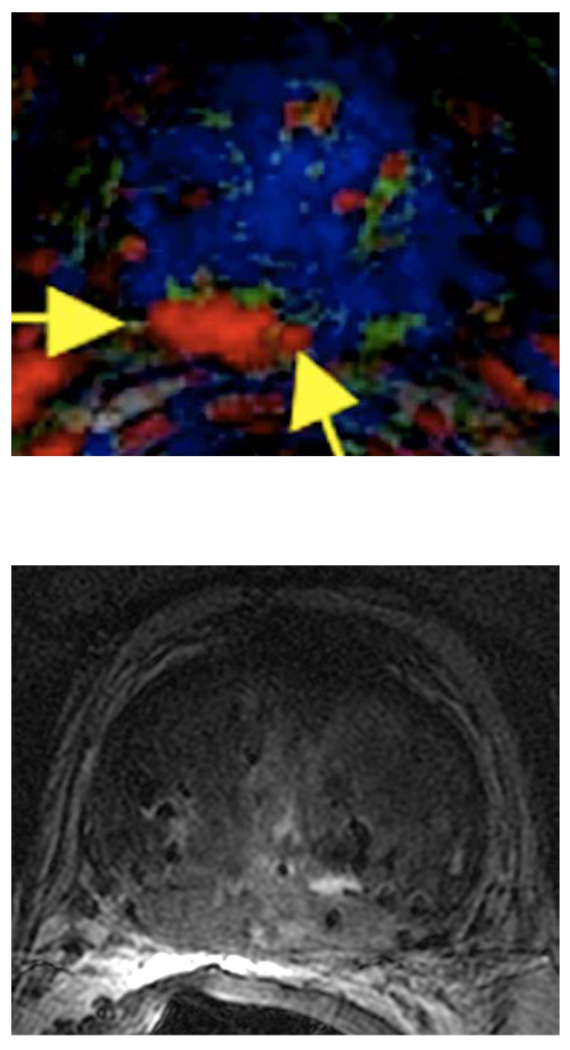
Figure 2.
a. DCE 3D-Gradient-Echo (6.9/2.1) 2.6-mm-thick pre-contrast image: Note the signal voids (seeds) and the clear depiction of prostate capsule (white arrow) and neurovascular bundles (arrow head).
b. Corresponding DCE 3D-Gradient-Echo (6.9/2.1) 2.6-mm-thick early post-contrast image. Note the tumor showing early wash-in (black arrows) on the background of relatively low perfusion of the radiated gland. The Brachytherapy seeds are represented as focal signal voids. Note also the proximity of the tumor to the rectal wall (black arrowhead).
c. Corresponding color-coded DCE 3D-Gradient-Echo (6.9/2.1) 2.6-mm-thick image showed cancer (geographic area with confluent bright red pixilation) in the right posterior peripheral zone (yellow arrows).
d. Axial T2-W FSE (5800/160) 2.2-mm-thick image of the mid-third of the prostate. (Corresponding to Fig. 1 a, b). Note that the entire prostate gland shows low signal due to post radiation changes, and therefore, the tumor cannot be delineated.


