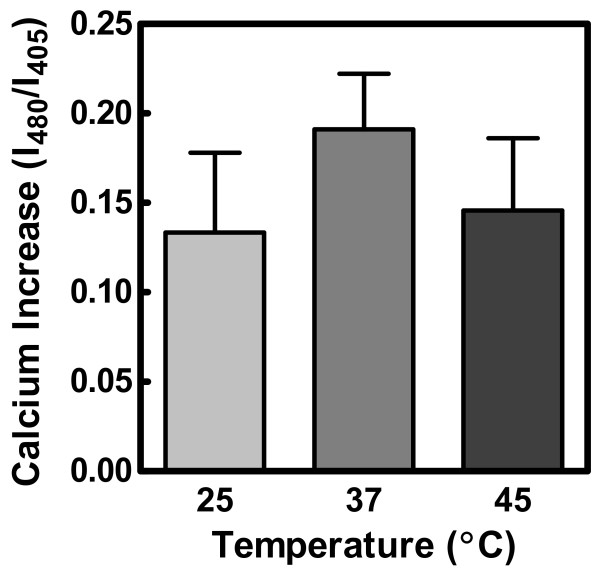
Figure 3.
Effect of temperature on calcium transport by ionomycin. Data were obtained using indo-1 to monitor internal calcium concentration (see Materials and Methods). Calcium concentration was estimated by calculating the ratio of fluorescence emission intensities at 480 to 405 nm. Data were analyzed by one-way analysis of variance (p = 0.71, n = 2–3) and are expressed as mean ± SEM.

