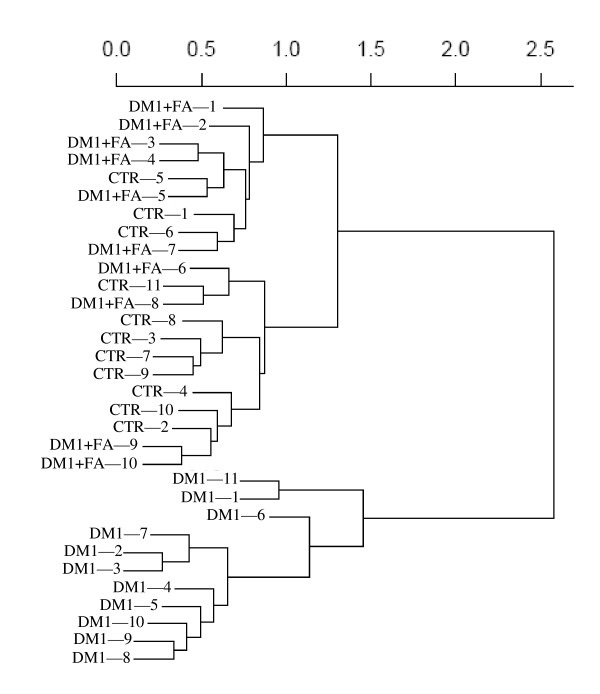
Figure 2.
Similarity of gene expression profiles of EPC between healthy controls and FA-treated DM1 patients. Unsupervised hierarchical clustering based on gene expression of EPC from DM1 patients before and after FA treatment and healthy controls. Clustering of conditions partitioned samples into 2 groups. The gene expression profiles of healthy controls (CTR) and FA-treated DM1 patients are clustered together as a distinct group, separated from the gene expression profiles of EPC from patients with DM1 before FA-treatment.

