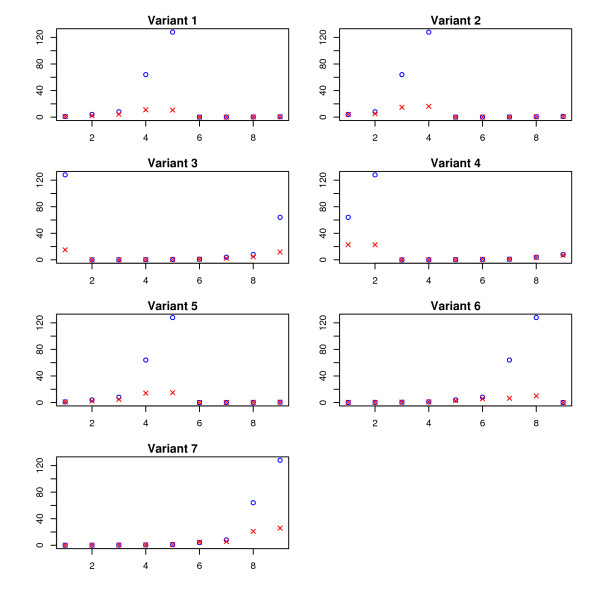
Figure 5.
Across-experiment ratios (on HG-LS data). The estimated values are denoted by crosses, while the true concentration ratios are denoted by circles. For each of the seven variants, we compare the across-experiment quantities (defined in (a) in the subsection of HG-LS Data) between the estimated  and the true T.

