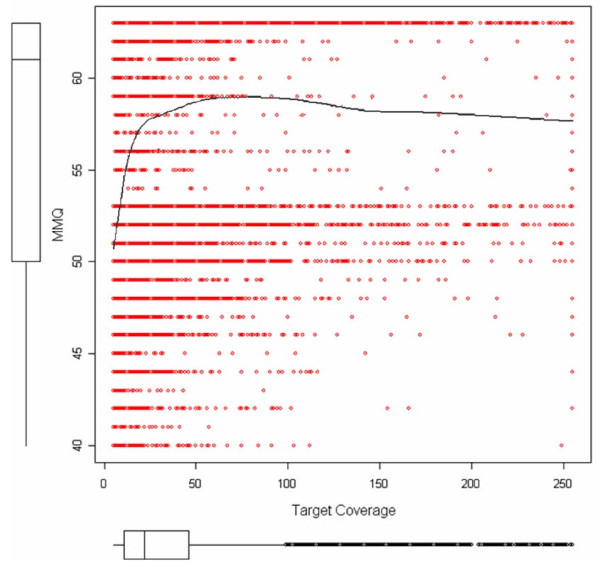
Figure 1.
Maximum mapping quality (MMQ) (mapping quality of the best mapped sequence of a cluster) on an SNP position versus target coverage. Box plots show the data distribution for each parameter. Red dots show MMQ values for the best mapped sequence on an SNP position versus target coverage. The black solid line shows the smooth-fit line.

