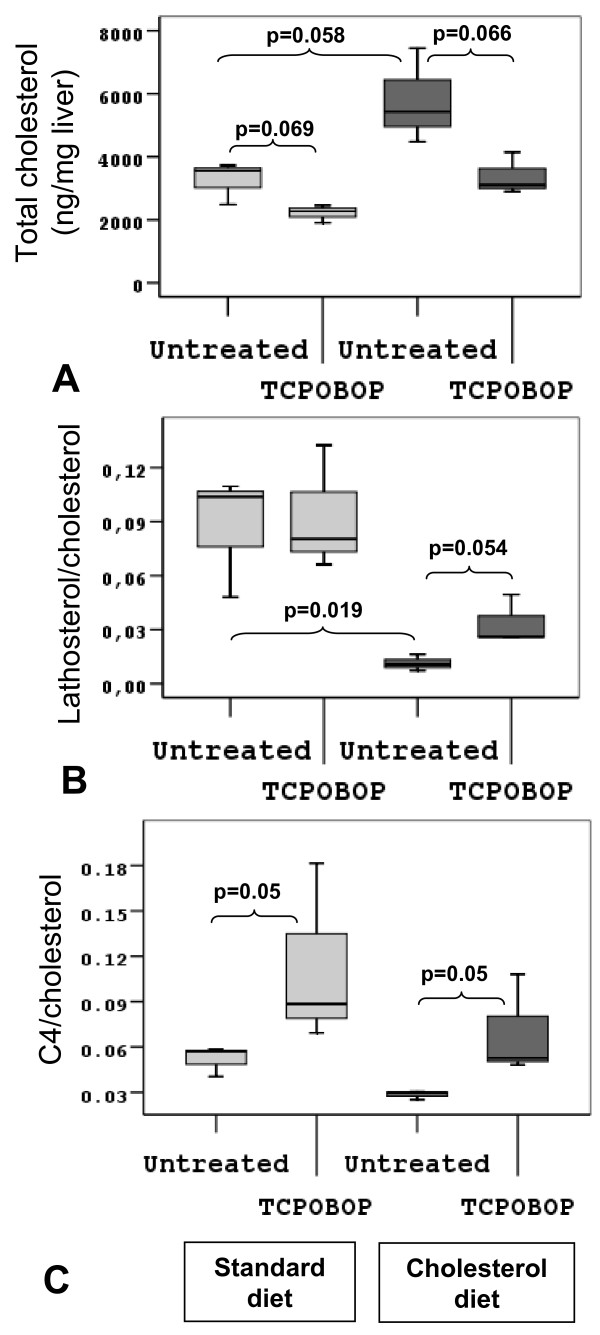
Figure 1.
Liver sterol profiles in TCPOBOP treated mice. Liver sterol profiles in mice as measured by GC-MS (3 biological samples per group) fed either standard (light box) or 1% cholesterol diet (dark box), and treated either vehicle or TCPOBOP. p-values are indicated between different groups. A. Total liver cholesterol level (ng/mg liver). B. Free lathosterol/total cholesterol level ratio indicates the metabolic rate of liver cholesterol biosynthesis. C. Free C4 (7-α-hydroxy-4-cholestene-3-one)/total cholesterol ratio. C4 is an intermediate in bile acid biosynthesis and shows a metabolic rate of the classical CYP7A1 pathway.

