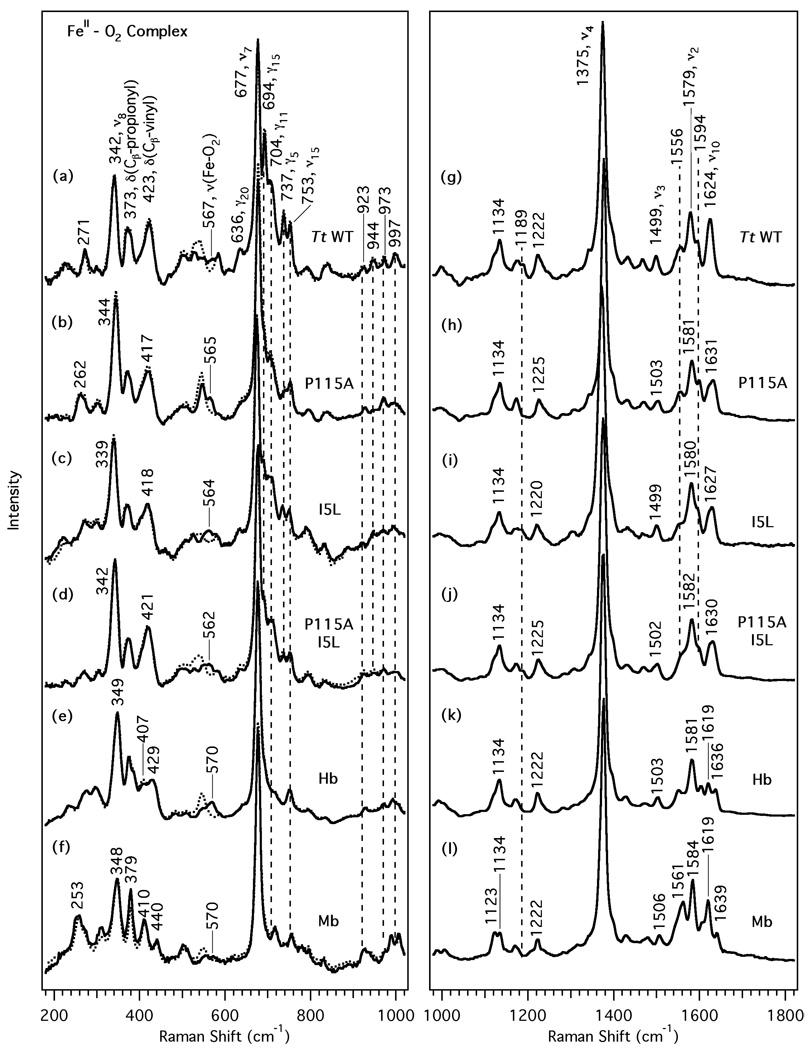
Figure 3.
Resonance Raman spectra of the O2 complexes of the Tt H-NOX domains and globins. The left panel shows the lower frequency region for Tt H-NOX WT (a), P115A (b), I5L (c), P115A/I5L (d), Hb (e), and Mb (f). 18O2 spectra (dotted line) are overlapped over the 16O2 spectra to indicate the frequency shifts upon isotopic substitution. The right panel shows the high frequency region (traces g-l).

