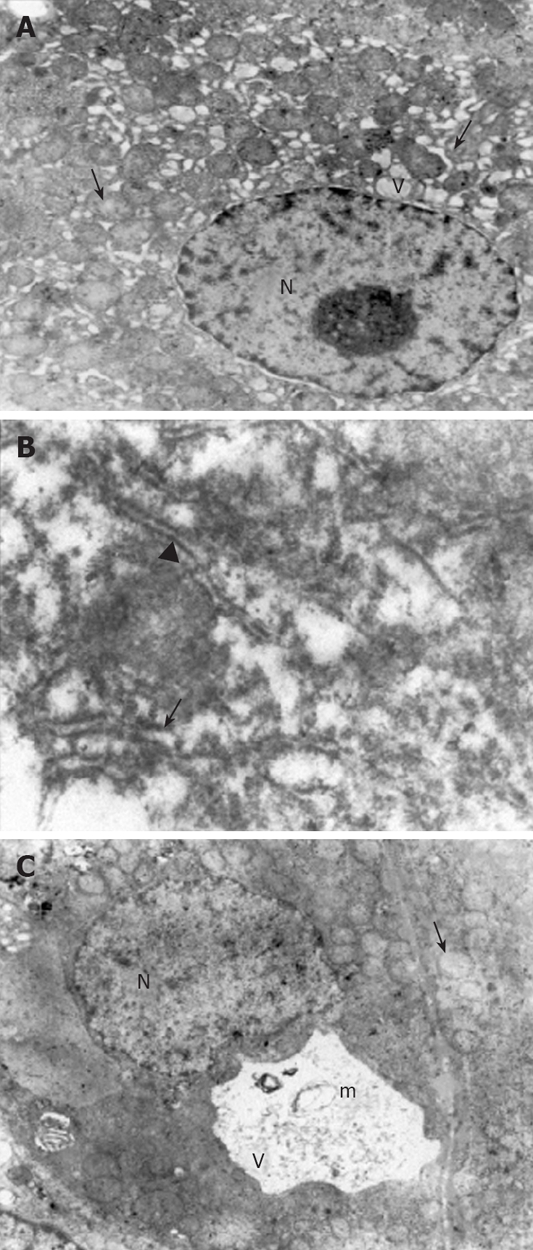
Figure 2.

Electron micrographs. A: The dilatations in the rER (arrow) and sER (arrowhead), large vacuoles in the hepatocytes (V), a normal nucleus (N) and mitochondria with a prominent edema (small arrow) in CCl4 plus taurine treated group (× 4000); B: Large dilatations (arrow) and focal breaks (arrowhead) in the rER in CCl4 plus saline treated group (× 30 000); C: The vacuolizations (V) and myelin figures (m) in the sER, nucleus (N) and mitochondria with prominent edema (arrow) in CCl4 plus saline treated group (× 4000).
