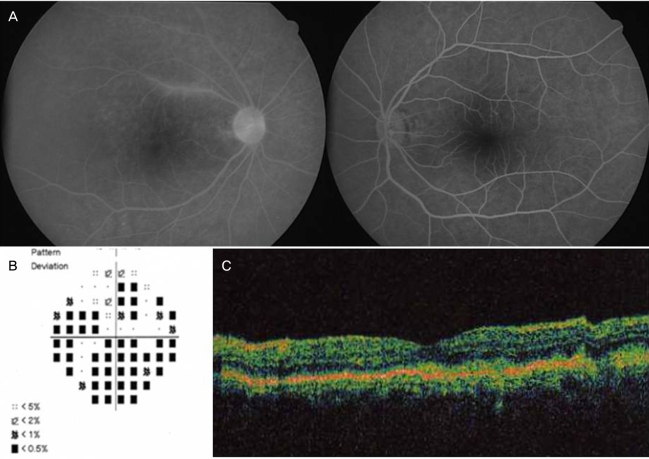
Fig. 1.
(A) Fluorescein angiography; some perivascular dye leakage, disc hyperfluorescence and granular patterns of scattered hypofluorescent and hyperfluorescent spots are seen in the right eye. (B) Visual field of the right eye; considerable peripheral constriction is seen in pattern deviation. (C) OCT of the right eye; small RPE humps are seen.

