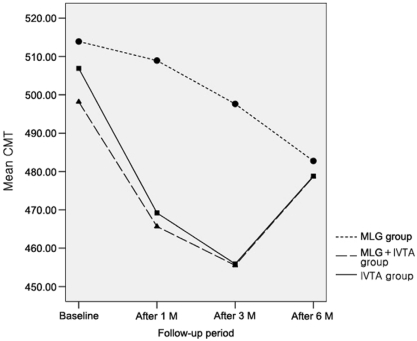
Fig. 2.
Graph illustrating central macular thickness (CMT) in eyes-affected with DME. In the MLG+IVTA and IVTA groups, compared with baseline, values were significantly lower at all time points (Wilcoxon signed ranks test). Compared with the MLG, values for the MLG+IVTA and IVTA groups were significantly lower at 1 and 3 months but had no difference 6 months after treatment. No deference was observed between the MLG+IVTA and IVTA groups (oneway ANOVA test).

