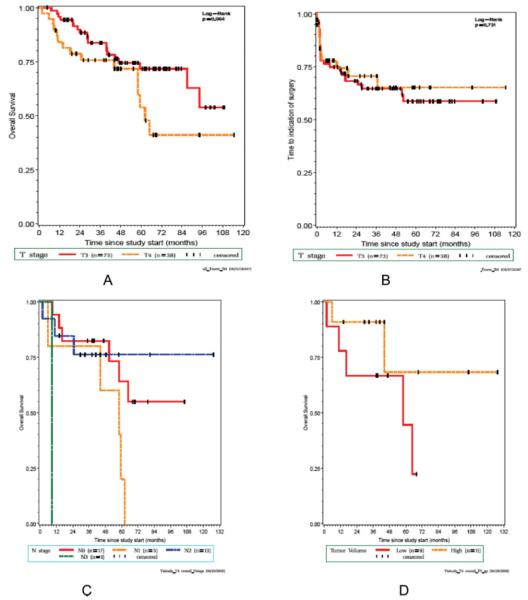
Fig. 3.
(A) Overall survival plots of patients with T4 disease and T3 disease (P = .064). (B) Laryngectomy-free survival plots of patients with T4 disease and T3 disease (P = .731). (C) Overall survival plots for T4 patients by nodal stage (P = .23). (D) Overall survival plots for T4 patients by tumor volume (P = .7); yellow indicates the smaller-volume tumors and red indicates large-volume tumors.

