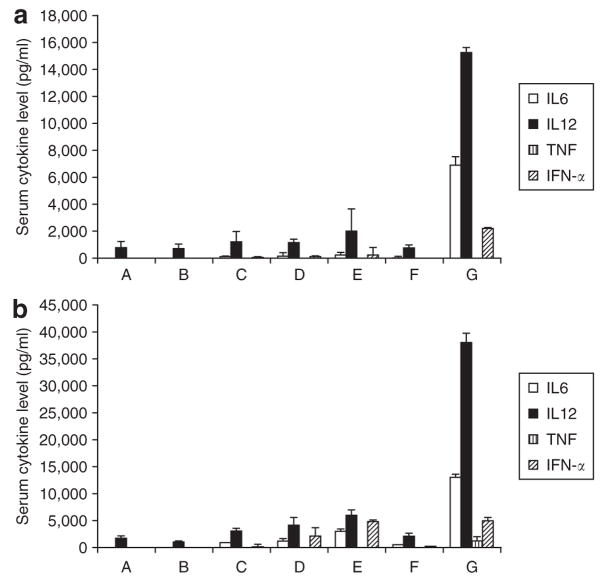
Figure 7. Serum cytokine analysis.
Serum cytokine levels in the (a) athymic nude mice and (b) C57BL/6 mice 2 hours after the injection of different formulations at the dose of 1.2 mg siRNA/kg (2.4 mg DNA/kg for group F). A, phosphate-buffered saline (PBS); B, epidermal growth factor receptor (EGFR) small interfering RNA (siRNA) in PBS; C, EGFR siRNA and calf thymus DNA in non-targeted nanoparticle (NP); D, EGFR siRNA and calf thymus DNA in targeted NP; E, MDM2 siRNA and calf thymus DNA in targeted NP; F, calf thymus DNA in targeted NP (empty NP); G, EGFR siRNA and plasmid DNA in targeted NP. Data = mean ± SD, n = 3–8.

