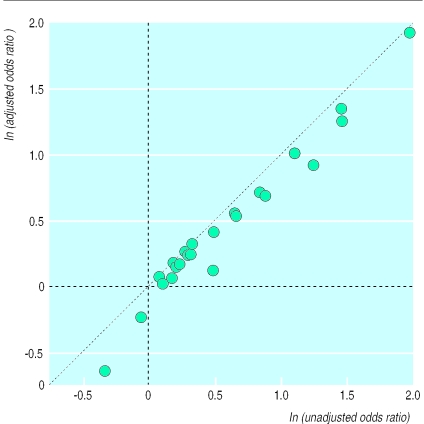
Figure 2.
Scatter plot of unadjusted versus adjusted odds ratios after filling with trim and fill method under random effects model. Dotted line is line of equality, and vertical distance away from this line indicates magnitude by which original pooled estimates have been reduced by adjusting for publication bias

