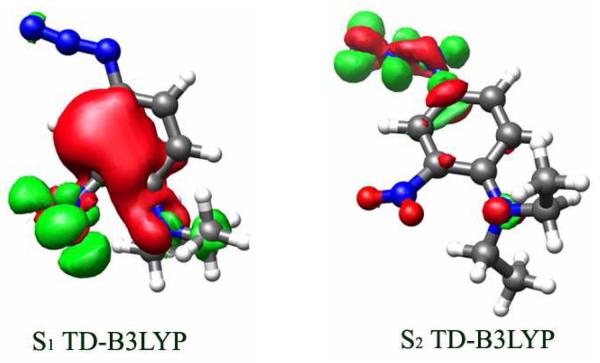
Figure 6.
Electron density redistribution in the (a) S1 and (b) S2 states of 5 calculated at the TD-B3LYP/TZVP level of theory. The green contours depict the accumulation of electron density in the excited state, and the red contours illustrate the loss of electron density from the S0 ground state. The contour values are ±0.005 a.u.

