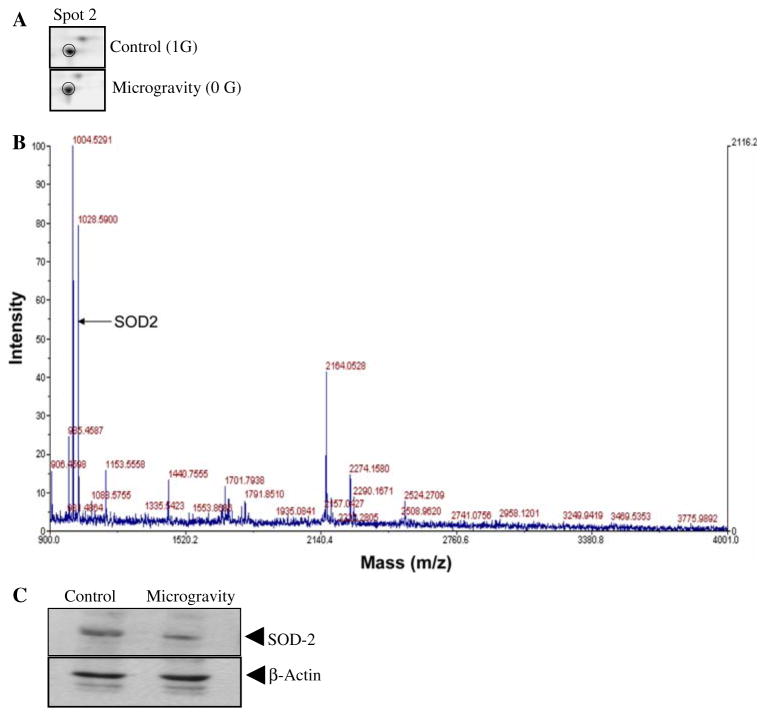
Fig. 3.
2DE profile of superoxide dismutase-2 in control and mice kept in simulated microgravity (a–c). (a) The panel shows enlarged regions of the 2DE protein profile representing changes in protein amount of Superoxide dismutase-2, (b) Superoxide dismutase-2 identification by peptide fingerprinting, (c) Western blot analysis of Superoxide dismutase-2 in control and in mice kept in simulated microgravity for 7 days. Beta-actin protein immunoblot was used for equal loading of samples

