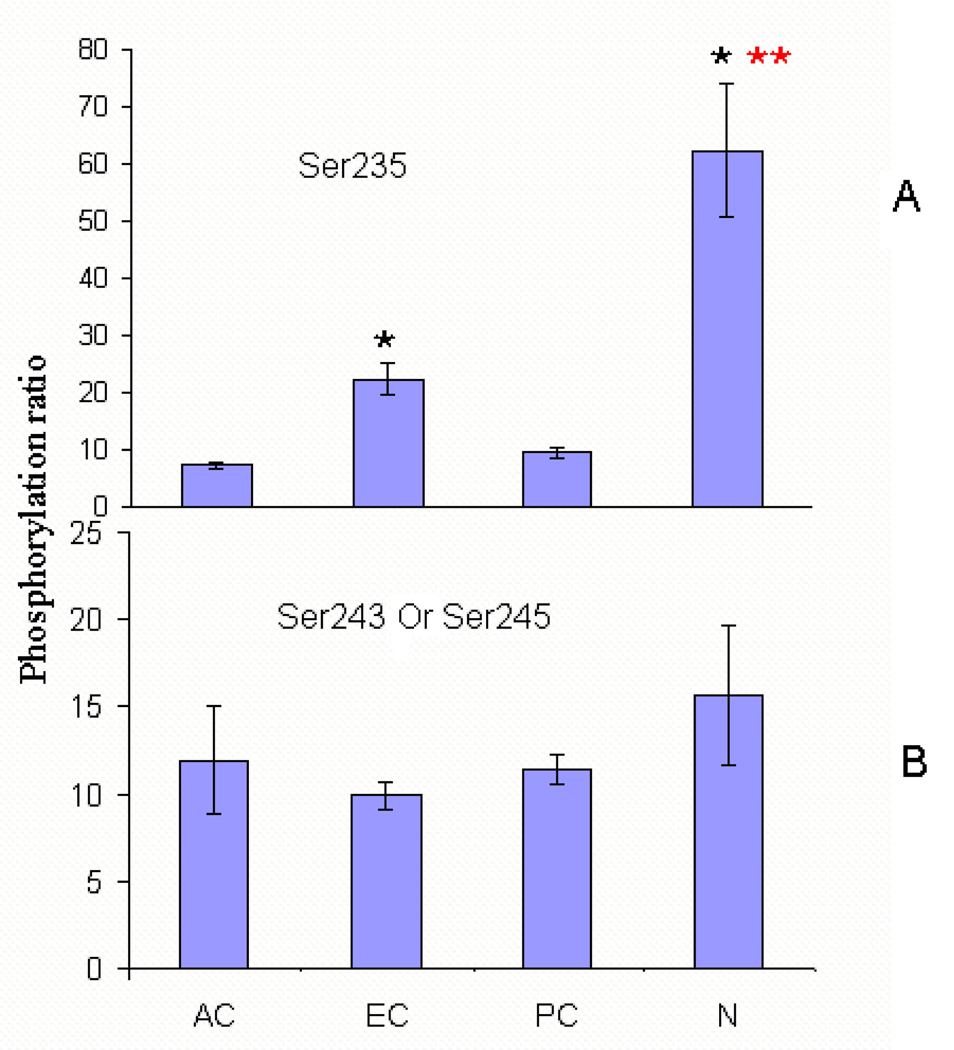
Figure 5.
The spatial distribution of AQP0 C-terminal phosphorylation. The relative percentage of phosphorylation in the different regions of the lens are expressed by the ratio of phosphorylation. The ratio of S235 phosphorylation = peak area of phosphorylated 229–238/ peak area of unphosphorylated 234–238; the ratio of phosphorylation on S243 or S245= peak area of mono-phosphorylated 239–259/ peak area of unphosphorylated 239–259. The ratios of phosphorylation are plotted: (A) S235 phosphorylation and (B) S243 or S245 phosphorylation. A single asterisk (*) indicates significance compared to the anterior outer cortex. A double asterisk (**) indicates significance compared to the equator outer cortex (p< 0.01). AC, anterior cortex; EC, equatorial cortex; PC, posterior cortex; N, nucleus.

