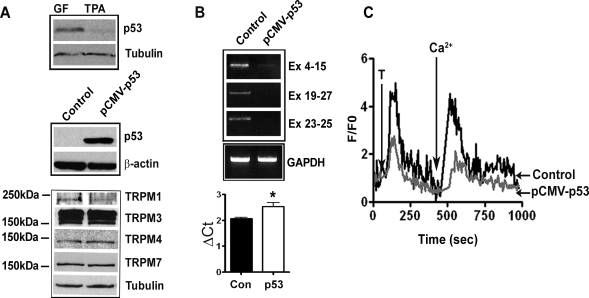
Fig. 5.
Inhibition of TRPM1 expression and Ca2+ influx by p53. A: Western blot analysis of p53 expression in melanocytes cultured in TPA and GF medium (top), melanocytes transfected with vector control or pCMV-p53 plasmid (middle). Expression of members of TRPM family (bottom) in melanocytes transfected with vector control or pCMV-p53. B: TRPM1 mRNA expression by RT-PCR in melanocytes transfected with vector control and pCMV-p53 plasmid (top) and quantitation of TRPM1 mRNA by real time PCR (bottom; *P < 0.05). C: cells transfected with the vector and pCMV-p53 were analyzed by Ca2+ imaging as described in materials and methods and in Fig. 2E.

