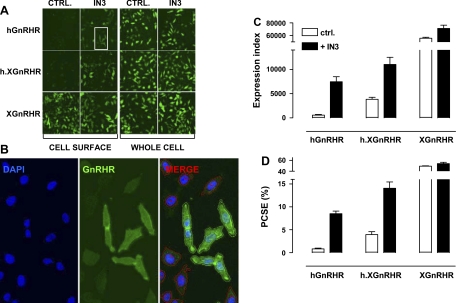
Fig. 1.
Quantification of hemagglutinin (HA)-tagged gonadotropin-releasing hormone (GnRH) receptors in HeLa cells by fluorescence immunohistochemistry with semiquantitative image acquisition and analysis. HeLa cells were transduced with the adenovirus (Ad)-expressing HA-tagged hGnRHRs, human Xenopus GnRHRs (h.XGnRHRs), or XGnRHRs [1 plaque-forming unit (pfu)/nl] and then incubated 18 h in medium with 0 or 10−7 M IN3. They were then stained for cell surface receptors [incubation of intact cells with primary antibody (Ab)], and nuclei were stained with 4′,6-diamidino-2-phenyindole (DAPI), before image acquisition and analysis as described in materials and methods. To measure whole cell receptor expression, permeabilized cells were exposed to primary and secondary Ab before imaging as above. A: thumbnail images from individual wells stained for cell surface and whole cell receptor expression after transduction with Ad GnRHR. CTRL, control. B: higher magnification for a region of cells (IN3-treated cell surface HA-hGnRHRs from the white-boxed thumbnail region in A) stained for nuclei (DAPI, blue) or GnRHR (green). The merged image illustrates the perimeters of the nuclei and cells determined using IN Cell 1000 Analyzer software and the application of a filter to define positively (+ve) stained cells (HA-hGnRHR staining >20% above background - green perimeter traces) and negatively stained (−ve) cells (HA-hGnRHR staining <20% above background - red perimeter traces). C: expression index (EI) calculated by compounding the percentage of +ve cells by the mean receptor fluorescence intensity (arbitrary units). D: proportional cell surface expression (PCSE) calculated by expressing the cell surface EI as a percentage of the whole cell EI. These data are all from the same representative experiment, and bar charts show means ± SE for 4–8 replicate wells (i.e., data derived from >5,000 individual cells).

