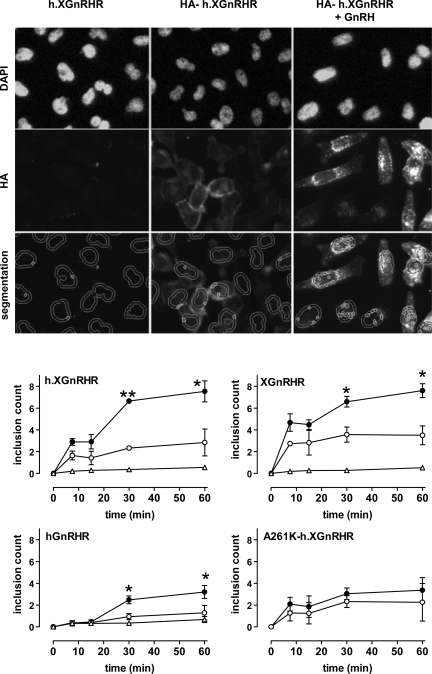
Fig. 5.
Anti-HA loading: time and agonist dependence. Top rows: representative images from HeLa cells transduced with h.XGnRHR (no HA tag) or from cells expressing HA-tagged h.XGnRHR before being washed and incubated 30 min at 37°C with primary Ab (mouse anti-HA at 1:200) with 0 or 10−7 M GnRH as shown. These incubations were terminated by washing at 4°C, before fixation, permeabilization, and staining (DAPI and Alexa Fluor 488-conjugated anti-mouse IgG), followed by image acquisition and analysis. Bottom row: illustration of the use of automated algorithms to segment the images, defining the perimeters of the nuclei (from the DAPI stain), adding a 2-μm collar, and identifying the bright punctuate regions of HA-GnRHR stain within the cross-sectional area defined by nucleus and collar. This number (“inclusion count,” the mean number of the small circles in the segmented images) provides a measure of receptors that have trafficked from the plasma membrane to putative endosomes. In the bottom panels, HeLa cells transduced with HA-tagged hGnRHR, h.XGnRHR, A261K-h.XGnRHR, or XGnRHR (1 pfu/nl) were incubated for 0–60 min at 37°C in medium with primary antibody and 0 (○) or 10−7 M GnRH (●, GnRH II for the XGnRHR) as indicated. Nontagged versions of three of the GnRHRs were also included as negative controls (▵). The cells were washed, fixed, permeabilized, and stained before image acquisition and analysis, as above. The data shown are inclusion counts as means ± SE (n = 3) pooled from 4 separate experiments (each with 4 replicate wells per treatment). *P < 0.05, **P < 0.01 compared with corresponding control value without GnRH.

