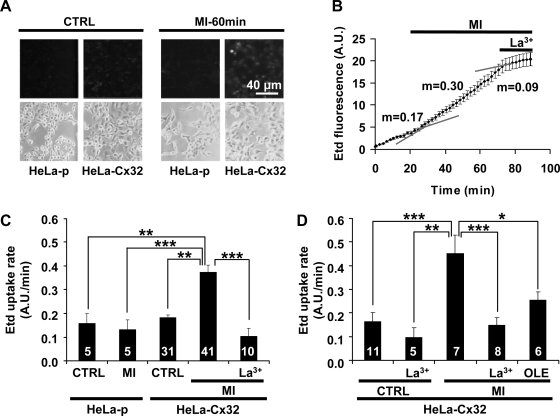
Fig. 1.
Metabolic inhibition enhances ethidium (Etd) uptake in HeLa cells transfected with connexin32 (HeLa-Cx32) but not in HeLa-parental (HeLa-p) cells. Fluorescent and corresponding bright-field images of cells exposed to 100 μM Etd for 2 min are shown. A: HeLa-p and HeLa-Cx32 cells under control conditions (Ctrl) or after 60 min of metabolic inhibition (MI-60min). B: representative plot of intensity of Etd fluorescence [in arbitrary units (AU)] over time. At the start of the experiment, 5 μM Etd was added to the bath. At ∼20 min, cells were exposed to MI, and at ∼70 min 100 μM La3+ was applied. Each point is the average ± SE fluorescence of 9 cells. Gray lines correspond to extrapolations of the linear regressions computed for each condition; m, rate of Etd uptake. C and D: rates of Etd uptake (5 μM) measured in low-confluence and subconfluent cultures of HeLa-p and HeLa-Cx32, respectively. Shown are rates of Etd uptake under control conditions (CTRL) or under MI, MI + 100 μM La3+ (La3+), or MI + 200 μM oleamide (OLE). Number of experiments is indicated in each column. Each experiment monitored fluorescence in 15 (C) and 25 (D) cells. Each bar indicates mean ± SE. *P < 0.05, **P < 0.01, ***P < 0.001, 1-way ANOVA with Newman-Keuls posttest.

