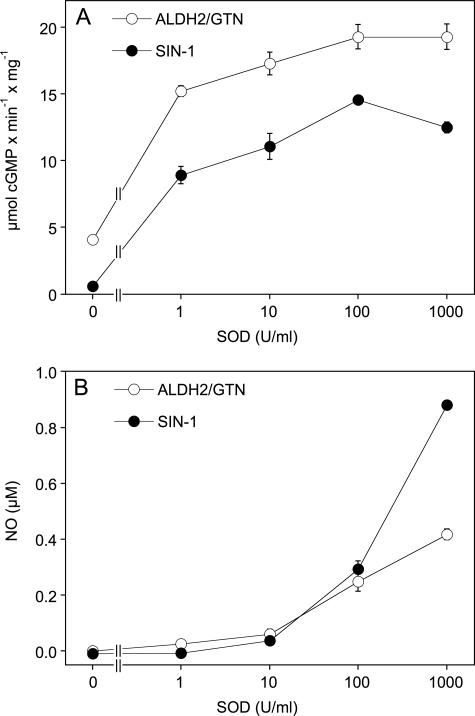
FIGURE 4.
Effects of SOD concentration on sGC activation and NO formation from ALDH2/GTN and SIN-1. A, purified sGC was incubated for 10 min as described in the legend to Fig. 3 in the presence of 25 μg WT-ALDH2/100 μm GTN or 100 μm SIN-1 and the indicated concentrations of SOD. B, SIN-1 (100 μm) or 0.25 mg of WT-ALDH2/100 μm GTN was incubated in 0.5 ml of 50 mm TEA buffer (pH 7.4) in presence of the indicated concentrations of SOD as described in the legend to Fig. 2. NO formation was monitored with a Clark-type NO electrode. The data are the mean values ± S.E. of three experiments.

