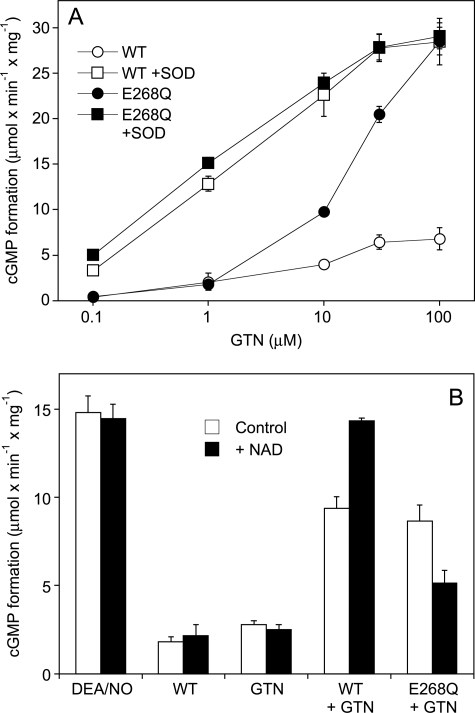
FIGURE 5.
Effects of GTN concentration and NAD on sGC activation. A, purified sGC was incubated for 10 min as described in the legend to Fig. 2 with increasing concentrations of GTN in the presence of 100 μg WT- or E268Q-ALDH2 with and without SOD (1,000 units/ml). B, purified sGC was incubated for 2 min as described in the legend to Fig. 2 with 0.1 mm GTN and WT- or E268Q-ALDH2 (2 μg each) in the presence of 1,000 units/ml SOD with and without 1 mm NAD. Control experiments were performed in the presence of 1 μm DEA/NO, WT-ALDH2 (2 μg) in the absence of GTN, and GTN (0.1 mm) in the absence of ALDH2. Samples were analyzed for [32P]cGMP as described under “Experimental Procedures”. Data are mean values ± S.E. of 3 independent experiments.

