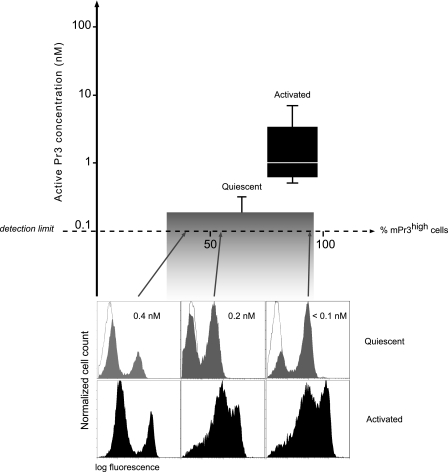
FIGURE 1.
Distribution and activity of membrane-bound proteinase 3 at the surface of quiescent and activated blood neutrophils. Top, box plot (n = 12) of Pr3 activity measured by incubating 300,000 cells/150 μl with the FRET substrate Abz-VADnorVADRQ-EDDnp. The lowest concentration of Pr3 activity that can be quantified is 0.1 nm. The width of the boxes reflects the percentage of mPr3high cells in each sample of quiescent and activated neutrophils, determined by flow cytometry. The selected blood samples are representative of the distribution of mPr3 in the population, which includes only 3% of monomodal mPr3low individuals (43). Bottom, flow cytometry analysis of representative neutrophil preparations from three healthy donors with different bimodal mPr3 distributions before (gray peaks) and after (black peaks) activation with the calcium ionophore A23187 and labeling with the anti-Pr3 mAbs (clone MCPR3–2). The thin lines represent nonspecific binding of isotype control IgG. Arrows indicate the percent of mPr3high quiescent neutrophils. The concentration of active mPr3 in each sample of quiescent neutrophils is indicated in nanomolar. It shows no correlation between the high/low mPr3 status and enzyme activity.

