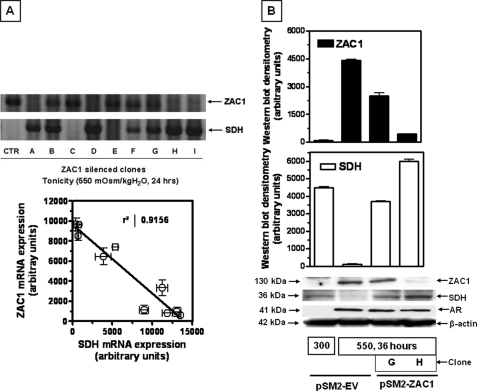
FIGURE 6.
Effect of ZAC1 silencing on SDH expression. A, upper, SDH mRNA analysis for nine ZAC1 clones silenced to varying degrees of expression and showing an inverse relation in expression between ZAC1 and SDH. A representative agarose gel for a single replicate per clone is shown. CTR, empty vector control. Lower, ZAC1-SDH mRNA plotted correlation for each clone (n = 3 replicates) demonstrating an R2 value of 0.9156. B, upper, validation of ZAC1 protein expression under acute hypertonic stress (550 mosmol/kg H2O for 36 h) in partially silenced clone G and fully silenced clone H compared with empty vector control cells. Lower, analysis for AR and SDH protein expression in the same clones depicting a substantial increase in SDH expression with lower levels of ZAC1 and without any change in AR expression. Western blot data were from three independent experiments (n = 9). A representative Western blot including β-actin loading control is shown. It is important to note that ZAC1 protein levels were absent in clones similar to empty vector control cells under isotonic conditions (data not shown).

