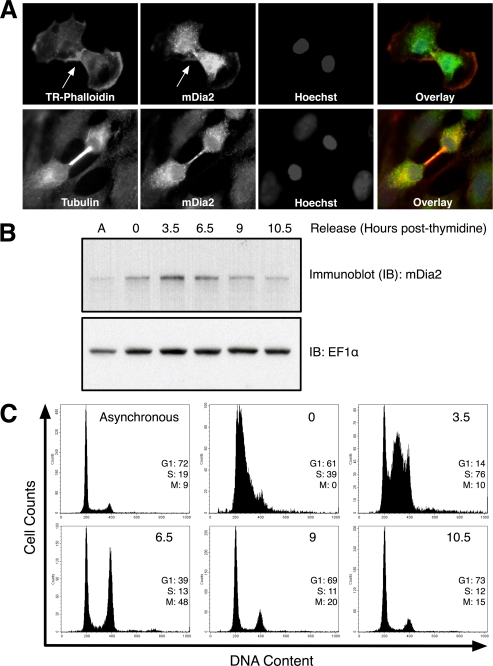
FIGURE 1.
mDia2 localization and expression is cell cycle-dependent. A, HeLa cells were stained with rabbit anti-mDia2 (fluorescein isothiocyanate (FITC)) and phalloidin (Texas Red) or mDia2 (fluorescein isothiocyanate) and tubulin (TRITC) along with DNA (Hoechst, blue). Overlay shows the merged image of all three channels. Arrows in the top panels denote the actin-rich cleavage furrow containing mDia2. B, HeLa cell lysates were collected at time points indicated after double thymidine G1/S arrest and release. A represents lysate from asynchronous population of cells. Immunoblots (IB) were probed with anti-mDia2 (1358) and anti-EF1α as a loading control. C, cells from B were labeled as described under “Experimental Procedures” to determine DNA content and analyzed on a flow cytometer. Plots show cell numbers relative to DNA content. The percentages of cells in G1, S, or M phase are shown for each time point.

