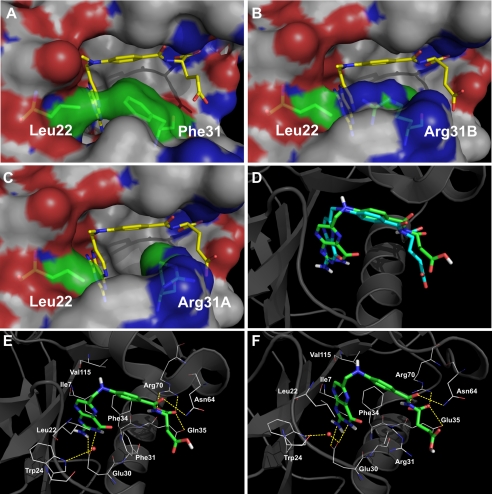
FIGURE 6.
Comparison of WT hDHFR and variant F31R/Q35E by modeling. A–C, surface representation of the contacts established between residues 22 and 31 in WT hDHFR (A, 1U72), variant F31R/Q35E with Arg-31B (B) or with Arg-31A (C) bound to MTX. MTX and residues 22 and 31 are in stick representation, colored by atom (C: yellow (MTX) and green (residues 22 and 31), O: red, N: blue). Surface is colored by atoms (C: white, O: red, N: blue). D–F, docking of folate onto WT hDHFR and variant F31R/Q35E. D, superposition of the original crystal structure 1DRF (WT DHFR bound to folate in blue) and the docking model of 1U72 (WT DHFR) docked with folate (in green). Results for the minimum energy binding conformers are shown for folate (E) docked onto WT hDHFR (1U72), as well as for folate (F) docked onto F31R/Q35E with Arg-31A conformer. The ligands are shown in stick representation while the residues are shown as lines, colored by atom (C: green (ligands) and white (residues), O: red, N: blue). Superposition was performed by Cα alignment of the crystal structures.

