FIGURE 2.
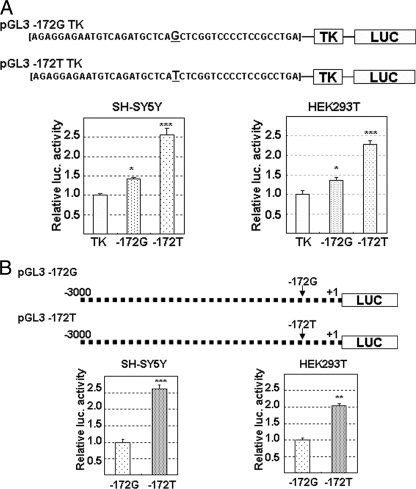
Transcriptional activity of G−172 or T−172 in MOR gene. A, pGL3G−172 → T TK were constructed by insertion of a 42-bp oligonucleotide containing G−172 → T upstream of TK in the pGL3 TK vector. B, pGL3T−172 or pGL3G−172 was constructed by insertion of respective MOR promoter gene, −3 kb upstream from transcriptional start site, to pGL3 basic vector. Luciferase assay was performed 24 h after each transfection of reporter vectors in SH-SY5Y cells or HEK293T cells. Relative luciferase activity of pGL3G−172 or pGL3T−172 was indicated against that of pGL3 TK (A), and that of pGL3T−172 was expressed against that of pGL3G−172 (B). Activities of coexpressed β-galactosidase were utilized for the correction of transfection efficiency in respective samples. The error bars indicates S.D. derived from three independent experiments. The asterisks indicate significantly difference (*, p < 0.05; **, p < 0.01; ***, p < 0.001).

