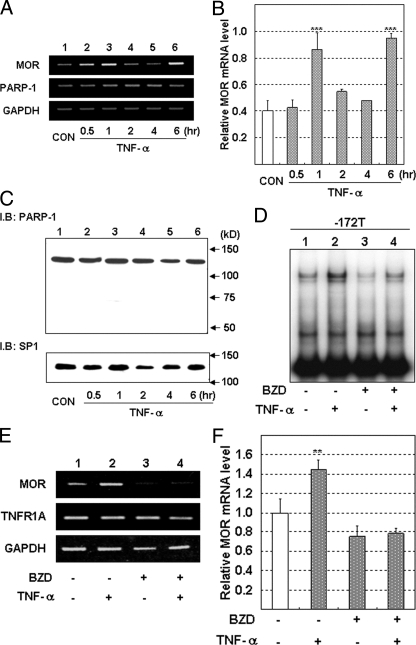
FIGURE 9.
Inhibition of TNF-α-induced PARP-1 binding to the T−172 probe, and of MOR mRNA expression, by PARP-1 inhibitor, BZD, in SH-SY5Y cells. Total RNA or nuclear protein in SH-SY5Y was prepared at respective times after the stimulation with TNF-α. A, MOR or PARP-1 gene expression was investigated by RT-PCR. B, relative MOR mRNA expression level was detected by real time RT-PCR. MOR mRNA expression in cells treated as in A was normalized to L19 mRNA expression. The error bars indicate S.D. derived from three independent experiments. The asterisks indicate significantly difference (***, p < 0.001). C, expression of PARP-1 protein or of SP1 protein for loading control (CON) was detected by WB. BZD was pretreated in SH-SY5Y 24 h before TNF-α stimulation. D, influence of BZD on the TNF-α enhanced PARP-1 binding to the T−172 probe was investigated by EMSA. E, influence of BZD on TNF-α enhanced MOR mRNA expression, or to TNFR1A gene expression, was monitored by RT-PCR. Lane 1, DMSO as a vehicle control; lane 2, 10 ng/ml of TNF-α; lane 3, 10 mm of BZD; lane 4, 10 mm of BZD and 10 ng/ml of TNF-α. PCR cycles of each gene were as follows: MOR, 26 cycles; PARP-1, 25 cycles; DRD2, 28 cycles; glyceraldehyde-3-phosphate dehydrogenase, 20 cycles. F, MOR mRNA expression level in SH-SY5Y treated with TNF- and/or BZD as for E was detected by real time RT-PCR and normalized to L19 mRNA. The error bars indicate S.D. derived from three independent experiments. The asterisks indicate significantly difference (**, p < 0.01).

