FIGURE 1.
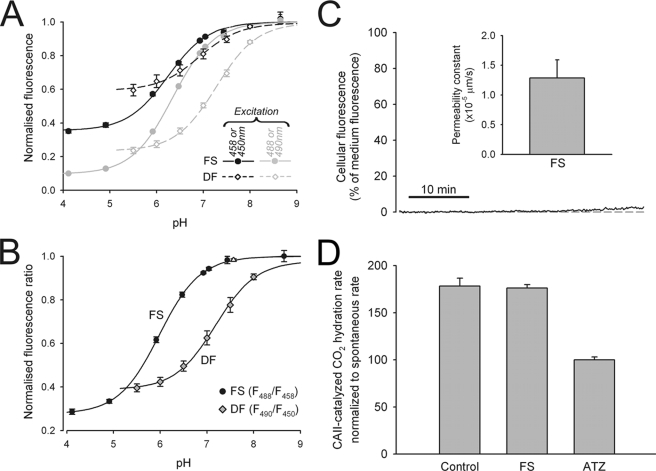
Characterizing fluorescein-derived dyes. A, fluorescence from 30 μm FS (circles) or from cell membranes loaded with 10 μm DF (diamonds), plotted versus superfusate pH. FS was excited at 458 nm (black) or 488 nm (gray) with an argon laser; DF was excited at 450 nm (black) or 490 nm (gray) with a xenon lamp. Data (n = 6–12/bin) were fitted to sigmoid curves. B, FS and DF fluorescence ratio versus pH. C, intracellular fluorescence during superfusion of EV cells with 30 μm FS, relative to superfusate fluorescence. Cellular dye uptake is negligible, indicative of low FS membrane permeability. D, rate of CO2 hydration at 4 °C in the presence of 10 nm bovine red cell CA2. The rates were also measured in the presence of 100 μm ATZ or FS (n = 5/bin). The data were normalized to the ATZ (spontaneous) rate. FS does not inhibit CA2 activity.

