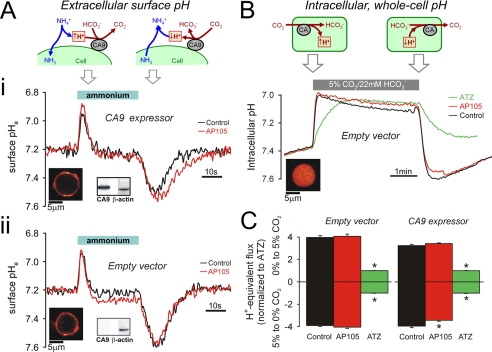
FIGURE 2.
Measuring CA activity in intact HCT116 cells. A, panel i, CA9-expressing cells loaded with membrane-inserting dye DF (see fluorescence map). Membrane fraction tested positive for CA9 protein by Western blotting (β-actin as control). Intact cells were superfused with 1% CO2, 2.2 mm HCO3− buffer (pH 7.2). Superfusion was switched rapidly for 30s to buffer containing 30 mm NH4Cl (pH 7.2). Transmembrane NH3 flux produces transient changes to surface membrane pHe (see cartoon). Surface pHe transients were smaller and briefer in the absence of CA9 inhibitor, 500 nm AP105 (red). Panel ii, protocol repeated on EV cells. Surface pHe transients are not different in the presence or absence of AP105, indicating a lack of CAe activity. B, EV cells AM-loaded with carboxy-SNARF-1 to measure pHi (see fluorescence map). The cells were superfused with CO2-free solution buffered by 20 mm Hepes (pH 7.4) and exposed for 4min to superfusate buffered by 5% CO2, 22 mm HCO3− (pH 7.4). Transmembrane CO2 flux produces pHi changes, at a rate determined by CA catalysis (see cartoon). Protocol was repeated in the presence of AP105 (500 nm) or ATZ (100 μm). ATZ blocks all CA activity. In EV cells, AP105 has no effect on catalysis, indicating that the drug does not enter cells. C, initial pHi slope on the addition and removal of CO2 for EV (n = 30) and CA9 expressor cells (n = 30). AP105 had a small but significant effect only in CA9-expressing cells, in response to extracellular CO2 removal.

