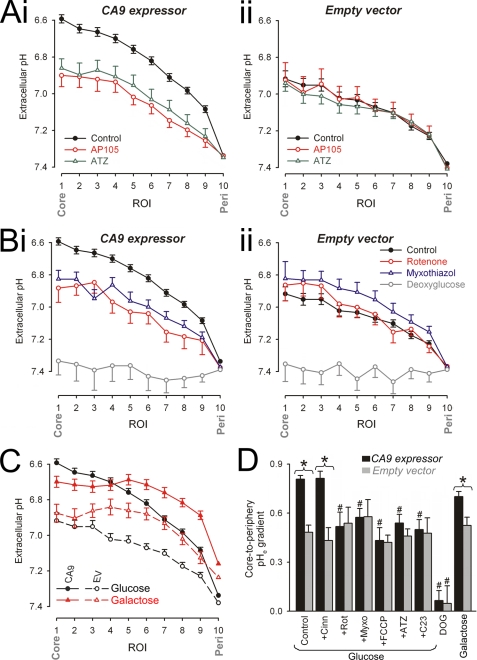
FIGURE 4.
Pharmacological studies of extracellular pH gradients. A–C, imaging for pHe with dye FS in spheroids superfused with 5% CO2, 22 mm HCO3− buffer. The data are presented as radial pHe profiles. *, significant difference between control and drug. A, data for CA9-expressing (panel i) and EV spheroids (panel ii). Black filled circles, drug-free conditions (spheroid radius of 299.0 ± 2.7 (panel i) and 297.6 ± 2.67 μm (panel ii)). Red open circles, with 500 nm AP105 (spheroid radius of 307.0 ± 6.3 (panel i) and 303.0 ± 5.7 μm (panel ii)); Green open triangles, with 100 μm ATZ (spheroid radius of 308.6 ± 3.6 (panel i) and 296.6 ± 6.4 μm (panel ii)). B, data for CA9-expressing (panel i) and EV spheroids (panel ii). Black filled circles, drug-free conditions. Red open circles, with 1 μm rotenone (spheroid radius of 310.0 ± 5.9 (panel i) and 314.7 ± 6.2 μm (panel ii)). Blue open triangles, with 5 μm myxothiazole (spheroid radius of 325.1 ± 7.2 (panel i) and 319.5 ± 4.2 μm (panel ii)). Gray open squares, d-glucose replaced with DOG (spheroid radius of 278.7 ± 3.6 (panel i) and 305.0 ± 6.6 μm (panel ii)). C, pHe gradients in CA9-expressing spheroids (filled symbols) or EV spheroids (open symbols) respiring glucose (black symbols) or galactose (red symbols; spheroid radius of 299.4 ± 6.1 (panel i) and 29.5 ± 4.3 μm (panel ii)). D, core-to-periphery pHe gradient under different conditions. *, significant difference between CA9-expressing and EV spheroids. #, significant difference between data from the same spheroid type (EV or CA9 expressor). Cinn, α-cyanohydroxycinnamate.

