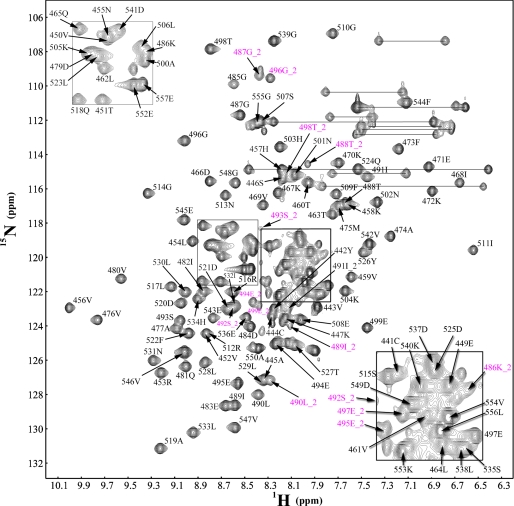
FIGURE 1.
Identification of the slow conformational conversion at the E2-binding site of the Ubl domain. 1H-15N HSQC spectrum of the Ubl domain of E1 with assignments indicated according to sequence of the full-length SAE2. The assignments corresponding to the minor conformation are indicated with a “_2” in magenta. The boxed areas are enlarged and shown at the corners of the spectra.

