FIGURE 3.
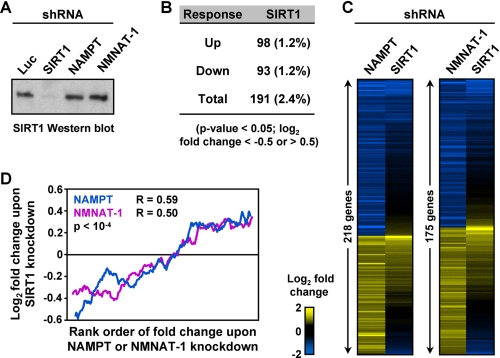
Many NAMPT- and NMNAT-1-regulated genes show similar patterns of regulation by SIRT1 in MCF-7 cells. A, stable shRNA-mediated knockdown of SIRT1 in MCF-7 cells. SIRT1 protein levels were determined by Western blot analysis. The shRNA constructs that knockdown NAMPT and NMNAT-1 (Fig. 1B) have no effect on SIRT1 protein levels. B, number of genes significantly regulated by SIRT1 knockdown (p < 0.05, Student's t test) after applying a -fold change cutoff (log2-fold change <−0.5 or >0.5) as determined by expression microarray analysis. Numbers in parentheses indicate the percentage of total expressed genes. The gene set is divided into up- and down-regulated groups. C, expression profiles of the NAMPT- and NMNAT-1-regulated genes (Fig. 2B) in response to SIRT1 knockdown. D, correlation analysis of the gene expression profiles shown in panel C. The plots show a 30-gene-moving average. Spearman's rank correlation coefficient (R) and p value are indicated.

