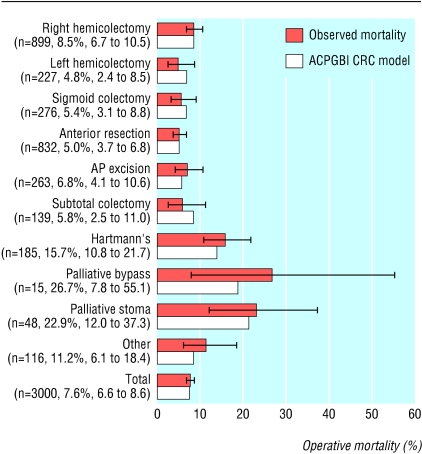
Fig 4.
Comparison of observed and predicted 30 day operative mortality by type of procedure on the validation set of 3000 cases (Hosmer-Lemeshow statistic 6.34, 8 df, P=0.610). For each procedure the number of cases, the observed 30 day operative mortality (%), and its 95% confidence intervals are displayed

