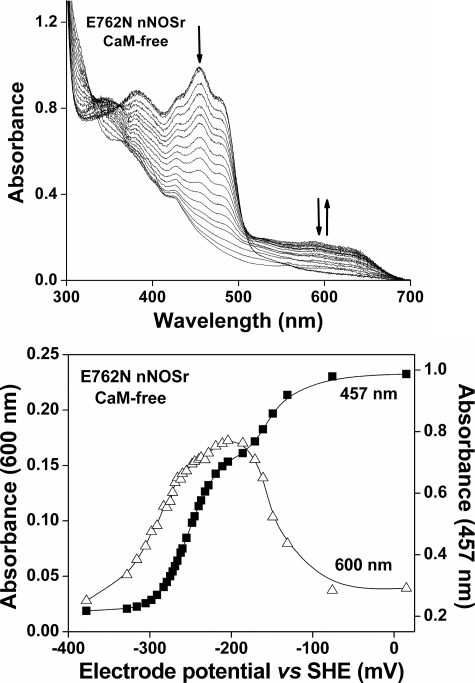
FIGURE 2.
Potentiometric titration of E762N nNOSr flavins in the absence of CaM at 15 °C. Top, representative set of visible spectra obtained during potentiometric titration of CaM-free E762N nNOSr with sodium dithionite. Bottom, plots of absorbance at 457 nm (solid squares) and at 600 nm (open triangles) versus the electrochemical potential (mV) for CaM-free E762N nNOSr along with the lines of best fit as calculated using the four-electron Nernst equation described under “Experimental Procedures.” Data are representative of at least two experiments.

