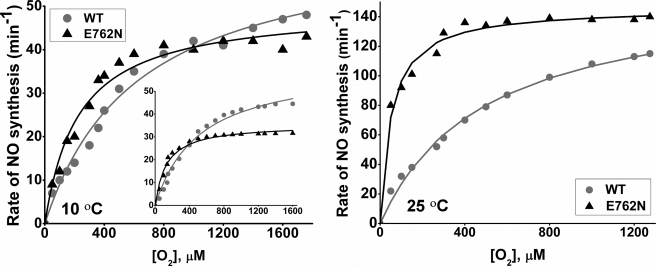
FIGURE 6.
Oxygen activity response curves for NO synthesis. The initial rates of NO synthesis were determined at each designated O2 concentration. Left, experimental data measured at 10 °C; right, experimental values measured at 25 °C. Simulated values at 10 °C are shown in the left panel (inset). The conditions are described under “Experimental Procedures.” WT, wild-type nNOS.

