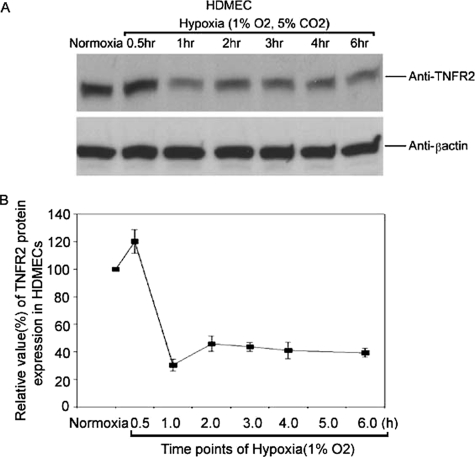
FIGURE 2.
Effects of hypoxia on TNFR2 protein levels. HDMECs were treated as in Fig. 1, and TNFR2 protein was analyzed by immunoblotting as described under “Experimental Procedures.” A chemiluminescence image is shown in A, and a densitometric quantitation of the same image is shown in B. Note that protein levels fall to ∼40% of the levels in normoxic cells. Data represent one of three experiments with similar results, although the kinetics varied slightly among different experiments.

