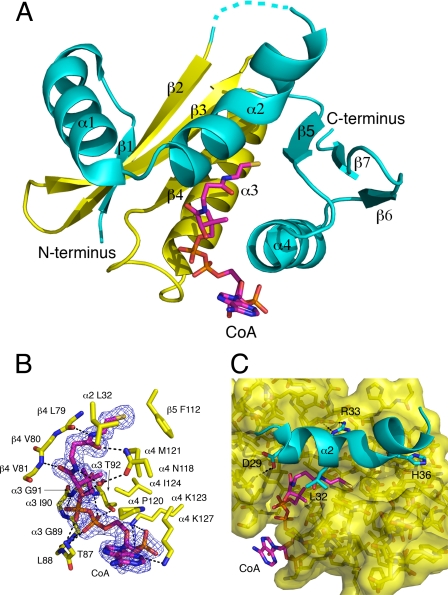
FIGURE 1.
Structure of the PAT·CoA complex. A, overall structure of the PAT·CoA complex. The conserved acetyl-CoA binding core region is in yellow, less conserved segments are colored in cyan, and CoA is colored by element. B, PAT-CoA interactions. The electron density is from a simulated annealing omit map contoured at 1.0 σ around the CoA. C, representation of the bent helix (α2) in cyan and the interactions that anchor it proximal to the active site of PAT. CoA is colored by element.

