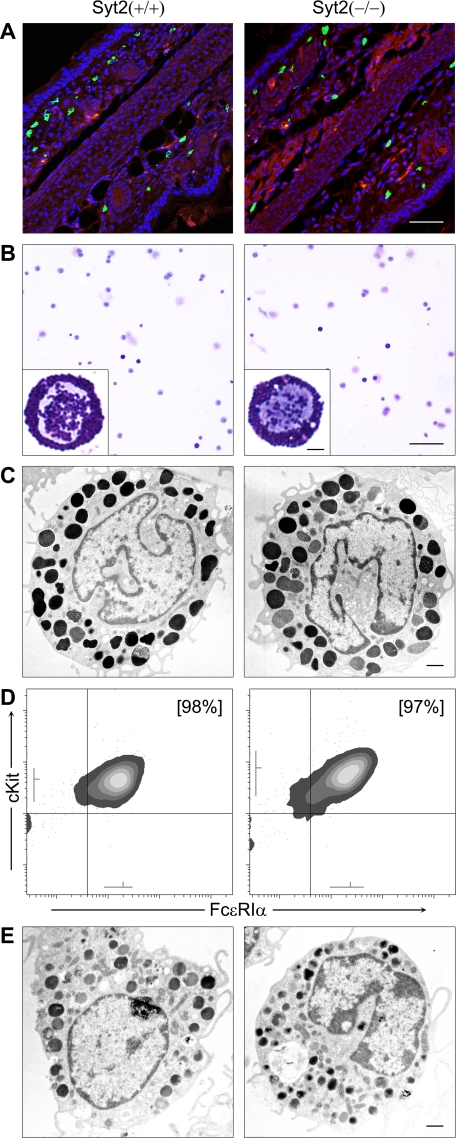
FIGURE 3.
Syt2 deficiency does not alter MC development, migration into tissues, or morphology. Representative images of samples obtained from P16 Syt2+/+ and Syt2−/− mice are shown. An in-depth morphometric analysis can be found in Table 1. A, fluorescent microscopy of ear sections (bar, 50 μm). MCs were labeled with FITC-avidin (green) and cell nuclei with Hoechst (blue). Background tissue was visualized as autofluorescence in the red channel. Syt2+/+ and Syt2−/− mice had similar densities of MCs in the dermis of their ears. B, cytospins of peritoneal lavages stained with Wright-Giemsa (bar, 100 μm). Insets depict higher power magnifications of representative MCs (bar, 5 μm). Syt2+/+ and Syt2−/− mice had similar numbers of MCs with similar gross morphology in their peritoneal cavities. C, transmission EM of peritoneal MCs (bar, 1 μm). MCs from Syt2+/+ and Syt2−/− mice had similar size and surface complexity, and similar number, size, and density of electron-dense granules. D, flow cytometry of BMMCs. After 6 weeks in medium supplemented with SCF and IL-3, BMMCs from Syt2+/+ and Syt2−/− mice had the same proportion of Kit+/FcϵRIα+ cells (% in brackets), and similar surface expression of both receptors (gray lines near both axes represent mean ± S.D. of fluorescence intensity). E, transmission EM of BMMCs (bar, 1 μm). Syt2+/+ and Syt2−/− BMMCs were indistinguishable.

