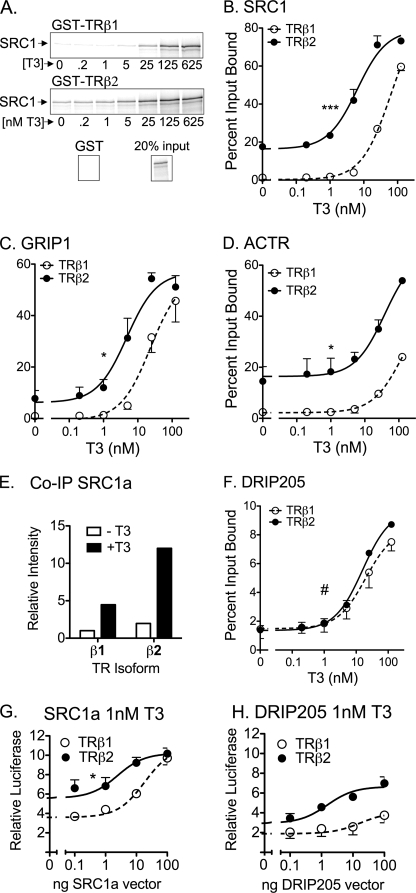
FIGURE 3.
Enhanced p160 coactivator recruitment by TRβ2. A, preferential binding of SRC1a by TRβ2 compared with TRβ1. Full-length, 35S-radiolabeled SRC1a was incubated with immobilized, GST fusions of full-length human TRβ1 or TRβ2 in the presence of increasing [T3] as indicated. The resulting coactivator-TR complexes were characterized by SDS-PAGE and phosphorimager analysis. A representative phosphorimager scan is presented. B, preferential binding of SRC1a by TRβ2 compared with TRβ1 quantification. A series of GST pulldowns were performed as in panel A and quantified by phosphorimager analysis. The coactivator bound to each receptor is expressed as a percent of input. Data represent the mean ± S.D. (error bars) of at least two independent experiments. C, preferential binding of GRIP1 by TRβ2 compared with TRβ1. Protocol was as in panel B. D, preferential binding of ACTR by TRβ2 compared with TRβ1. Protocol was as in panel B. E, preferential co-immunoprecipitation (IP) of TRβ2 by SRC1a. SRC1a and either HA-tagged TRβ1 or HA-tagged TRβ2 were introduced into HeLa cells by lipofection of the corresponding expression vectors. After 48 h, 100 nm T3 was added, or not, and the cells were incubated for 1 h more. The cells were lysed and the coactivator was immunoprecipitated with anti-SRC1 antibodies. The immunoprecipitates were analyzed by SDS-PAGE and immunoblot using anti-TRβ antisera. F, equal binding of DRIP205 by TRβ2 and TRβ1. Protocol was as in panel B. G, equalization of the transcriptional properties of TRβ1 and TRβ2 by ectopic expression of SRC1a. An expression construct for either TRβ1 or TRβ2 was transfected into CV-1 cells together with the DR4-luciferase reporter, the pCH100-lacZ internal control, and increasing amounts of an expression vector for SRC1a. The cells were incubated −T3 or +T3 and were analyzed for relative luciferase expression as described in the legend to Fig. 2. H, failure to equalize the transcriptional properties of TRβ1 and TRβ2 by ectopic expression of DRIP205. An expression construct for each TR isoform was introduced into CV-1 cells by lipofection, together with a DR4-luciferase reporter, a pCH100-lacZ construct, and increasing amounts of an expression vector for DRIP205. The cells were incubated and analyzed for relative luciferase expression as described in the legend to Fig. 2. Symbols in each panel indicate statistical confidence that TRβ2 differs in EC50 or Bmax from TRβ1 as follows: *, p < 0.05; **, p < 0.01; ***, p < 0.001; #, curves are not statistically distinguishable.

