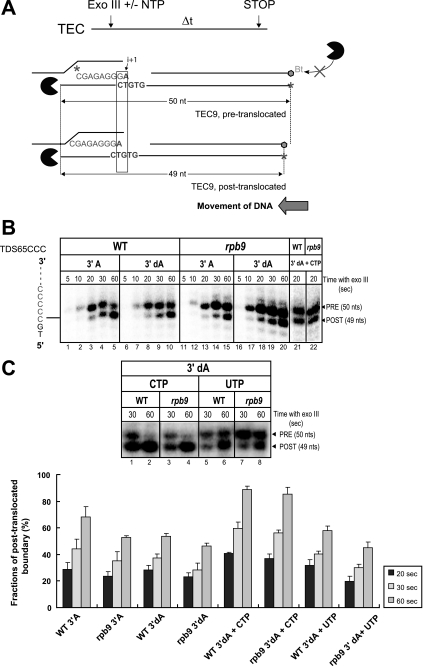
FIGURE 4.
Mapping of the translocation state of TECs using exonuclease III footprinting of the rear of pol II boundary. A, design of the Exo III experiment. The figure illustrates the pre- and post-translocated states of TEC9. The length of the template DNA strand protected from the digestion differs by one nucleotide between the pre-translocated (top) and post-translocated (bottom) state of TEC9. A biotin group (in black) at the 3′ end of the non-template strand prevents its degradation by Exo III (in gray). B, TECs by WT and pol IIΔ9 were assembled on templates NDS65CCC with the 5′-labeled RNA7 followed by walking to TEC8 by incubation with 5 μm GTP. TEC9 was obtained by a 5-min incubation of TEC8 with 10 μm ATP or 3′-dATP and was incubated for short time intervals with Exo III. C, forward translocation of 3′-dA-terminated TEC9 is stimulated by the correct CTP added at 1 mm simultaneously with Exo III. The bottom panel depicts dynamics of the appearance of the post-translocated footprint of TEC9. Error bars indicate S.E.

