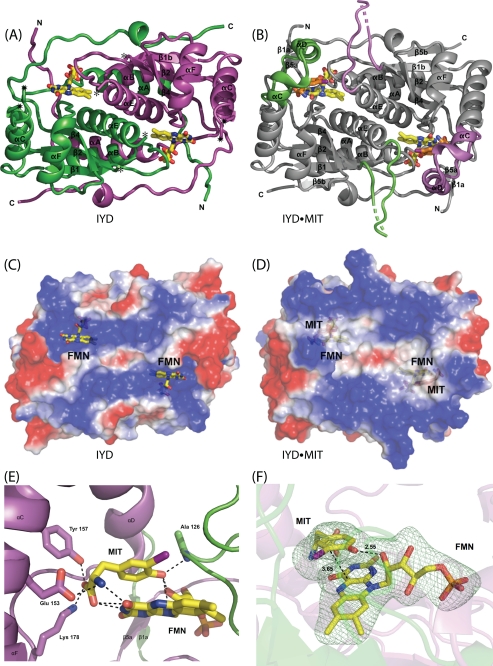
FIGURE 2.
IYD structure. A, an overall view of the native homodimer of IYD crystallized in the absence of substrate. Each monomer is distinguished by color. Disordered regions consisting of residues 156–177 and 195–208 connect to the structure as indicated by ★ and ☆, respectively. B, native homodimer of IYD crystallized in the presence of its substrate, MIT. Only the structure induced upon substrate binding is highlighted in the colors of the monomers shown in A. The surface properties of IYD (C) and its complex with monoiodotyrosine (D) were calculated using vacuum electrostatics in PyMOL (47). Blue indicates positive charge, and red indicates negative charge. E, ionic interactions and hydrogen bonding stabilize the FMN·monoiodotyrosine complex formed by IYD. F, the interaction between FMN and MIT in the active site of IYD. An Fo − Fc electron density map calculated after refinement in the absence of FMN and MIT is shown contoured at 3σ.

