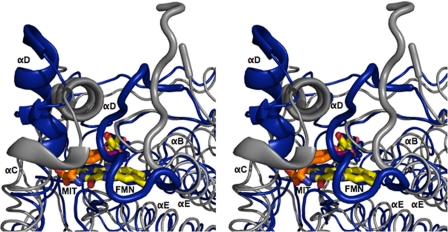
FIGURE 6.
Structural overlay of IYD and BluB. Structural differences between IYD·MIT (gray) and BluB (blue) are highlighted using an overlaid stereoimage. Structural changes near the active site are depicted with the schematic representation. The full-view overlay can be seen as a stereoimage in the supplemental information.

