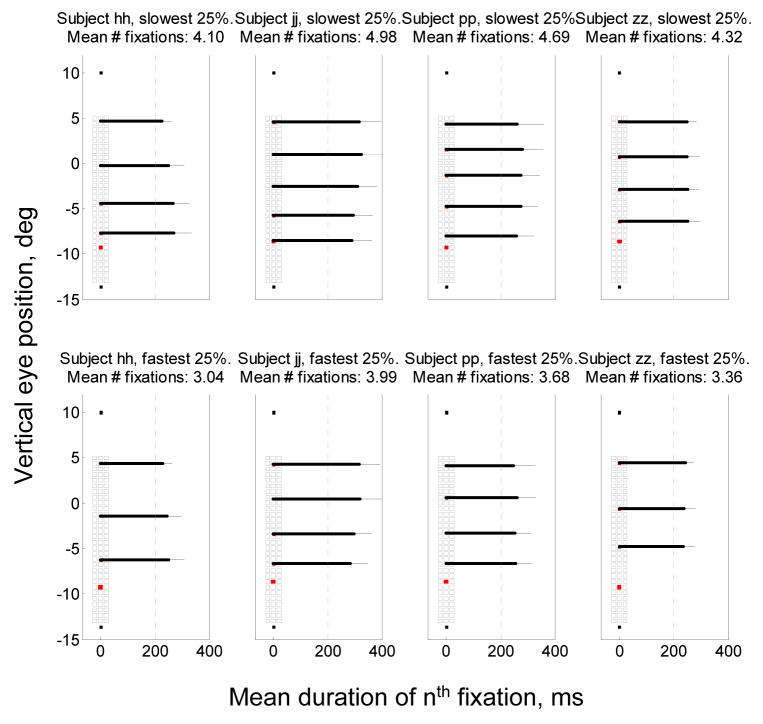
Figure 3.
Schematic average scanpaths of the slowest 25% and fastest 25% of all trials in which the target occurred in the bottom half of the search array, for each subject. Only mean fixation locations are shown; eye position during the saccade is not. Abscissa markings now designate fixation duration. Search speed was defined as time spent searching divided by the distance of the target from the beginning of the list; hence trials with equivalently placed targets could differ with respect to the amount of time taken to find the target. The gray box indicates the average target location for the corresponding trials. Horizontal bars denote the mean duration of the corresponding fixation; whiskers are 1 SD of the mean. The dotted vertical line at 200ms is for reference purposes.

