
Figure 4.
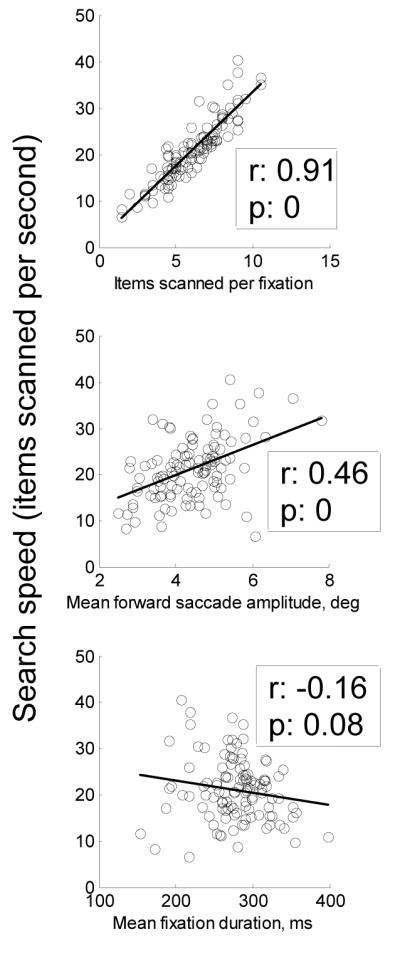
Correlations between performance on the search task, defined as search speed (items scanned per second), and oculomotor variables for representative session (jj, session 10). The ordinal relationship between correlation strengths—strongest for items scanned per fixation, moderate for mean forward saccade amplitude, and weakest for mean fixation duration—held for every individual session.